Gaussian PSF Fitter Performance Report – High-Resolution Characterization
Introduction
This report presents a comprehensive characterization of the rms-psfmodel
Gaussian PSF fitting library, evaluating its accuracy across a broad parameter
space. The results are produced by the characterize_gauss_fit tool using
the high-resolution configuration (hires_config.yaml), which employs
denser parameter grids and larger noise-sample counts than the default
configuration to produce smoother statistics and finer detail at intermediate
parameter values.
Purpose and Scope
The rms-psfmodel library fits 2-D elliptical Gaussian point-spread
functions (PSFs) to sub-images extracted from astronomical detector data.
The fitter recovers the sub-pixel position, PSF width (sigma), orientation
angle, and amplitude scale of the source. This report quantifies how
accurately the fitter recovers these parameters under controlled conditions
by comparing fitted values to known ground truth.
Eight focused studies each vary a small set of parameters while holding others fixed, probing different aspects of fitter performance:
# |
Study |
Question Addressed |
Trials |
Convergence |
|---|---|---|---|---|
1 |
Box Size vs. Sigma |
How large must the sub-image be relative to the PSF width? |
780 |
100% |
2 |
Subpixel Offset |
Does fractional pixel position introduce systematic bias? |
1,764 |
100% |
3 |
Minimum Detectable Offset |
What is the smallest recoverable positional shift? |
61,677 |
100% |
4 |
Sigma Asymmetry and Angle |
How well are elongated, rotated PSFs recovered? |
750 |
100% |
5 |
Constraint Modes |
How does fixing vs. floating sigma/angle affect accuracy? |
44 |
100% |
6 |
Background Conditions |
How do background models interact with fitting accuracy? |
2,100 |
100% |
7 |
Noise Sensitivity |
At what SNR does fitting accuracy degrade? |
20,000 |
100% |
8 |
Hot Pixel Rejection |
How effectively does sigma-clipping reject bad pixels? |
14,400 |
83.3% |
Total trials: 101,515. All studies achieve 100% convergence except
hot pixel rejection, where aggressive sigma-clipping (num_sigma=3)
causes systematic convergence failure.
Methodology
Each trial follows the same protocol:
Generate a synthetic PSF image using
GaussianPSF.eval_rect()with known sigma, angle, sub-pixel offset, and scale. The image is a pixel-integrated 2-D Gaussian on a square grid of sidebox_size.Corrupt the image with optional additive backgrounds (constant, linear, quadratic, or noisy), Gaussian detector noise, and/or hot pixels.
Fit the corrupted image using
GaussianPSF.find_position(), the same production API that downstream users call. The fitter uses Powell’s method to minimize the squared residual between the model and the data, with optional polynomial background subtraction and sigma-clipping for outlier rejection.Compute errors by comparing fitted parameters to the injected ground truth:
Position error (Euclidean):
sqrt((fit_y - true_y)^2 +
(fit_x - true_x)^2)
Sigma error (relative):
(sigma_fit - sigma_true) / sigma_trueScale error (relative):
(scale_fit - scale_true) / scale_trueAngle error (absolute, radians):
|angle_fit - angle_true|wrapped to[-pi/2, pi/2]
Error Metric Definitions
Throughout this report, position error is the Euclidean norm of the signed Y and X position residuals, measured in pixels. Sigma error and scale error are dimensionless relative errors (a value of 0.01 means 1% error). Angle error is an absolute difference in radians, reduced modulo 90 degrees due to the pi-symmetry of elliptical Gaussians.
For stochastic studies (noise, hot pixels, minimum detectable offset), each parameter combination is repeated with 50–200 independent noise realizations. Statistics are reported as mean +/- 1 standard deviation over these realizations.
Configuration Summary
The high-resolution configuration uses:
200 noise samples per stochastic condition (vs. 50 in the default)
12 box sizes from 5 to 41 pixels
13 sigma values from 0.3 to 5.0 pixels
21 x 21 subpixel offset grid (0.025 px resolution)
25 SNR points from 3.2 to 3162 (log-spaced)
25 angle steps (7.5 degree resolution)
The fitter uses tolerance=1e-6, use_angular_params=true, and
search_limit=[1.5, 1.5] pixels throughout.
Study 1: Box Size vs. PSF Sigma
Question: How large must the fitting sub-image be relative to the PSF width for accurate position, sigma, and scale recovery?
Box-Sigma Parameters
Parameter |
Values |
|---|---|
Box sizes |
5, 7, 9, 11, 13, 15, 17, 19, 21, 25, 31, 41 pixels |
Sigma (symmetric) |
0.3, 0.4, 0.5, 0.6, 0.8, 1.0, 1.25, 1.5, 2.0, 2.5, 3.0, 4.0, 5.0 px |
Sub-pixel offsets |
(0,0), (0.25,0.25), (0.5,0), (0,0.5), (0.5,0.5) |
Background/noise |
None (clean pixel integrals only) |
The study sweeps a 12 x 13 grid of box sizes and sigma values at five
sub-pixel offset positions, producing 780 noiseless trials. Background
subtraction is disabled (bkgnd_degree=null) so that only the intrinsic
truncation effect is measured.
Box-Sigma Results
All 780 trials converge. The position error heatmap reveals a sharp transition between catastrophic and excellent fits that depends on the ratio of box size to PSF sigma:
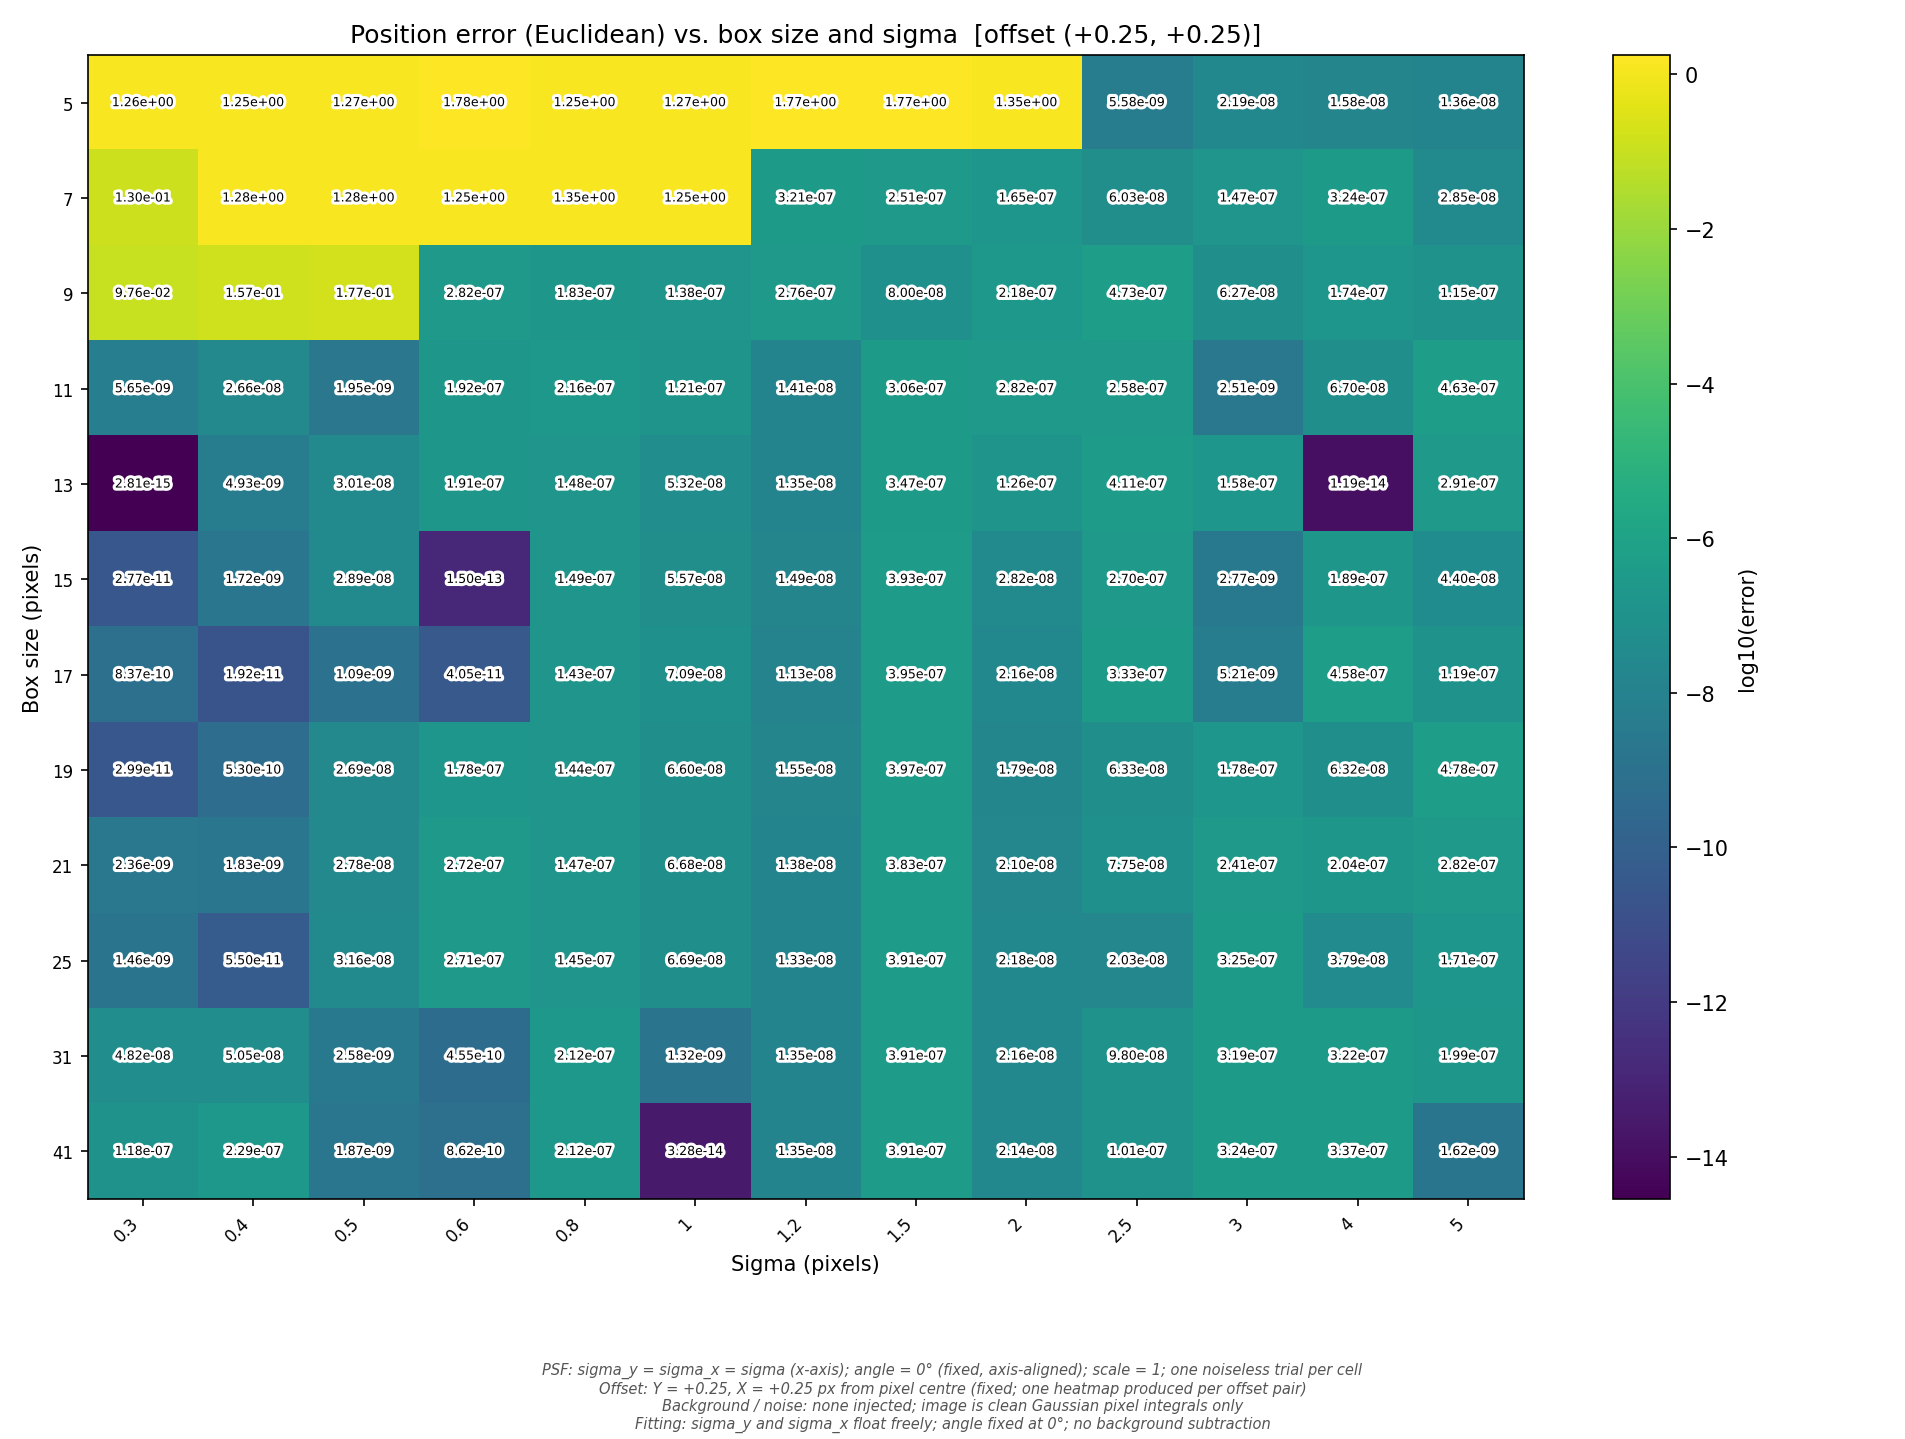
Position error (Euclidean, log10 scale) as a function of box size (rows) and PSF sigma (columns) at offset (+0.25, +0.25). Dark cells indicate sub-pixel precision; bright/yellow cells indicate catastrophic failure.
Regime |
Typical Position Error |
Sigma/Scale Error |
|---|---|---|
box >= 4*sigma + 1 (adequate) |
1e-7 – 1e-14 pixels |
< 1e-6 (relative) |
box < 4*sigma + 1 (truncated) |
0.1 – 2.1 pixels |
2x – 48x (relative) |
Box-Sigma Findings
Adequate box size threshold: When
box_size >= 4 * sigma + 1, the fitter achieves near-machine-precision accuracy. For a sigma=1.0 PSF, a 5-pixel box suffices; for sigma=5.0, a 21-pixel box is needed.Sharp cliff: The transition from good to bad is abrupt. For sigma=0.5, the fit jumps from
pos_err ~ 1e-10at box=7 topos_err ~ 2.0pixels at box=5. There is no graceful degradation.Sigma recovery is worst: When the box is too small, sigma errors reach 15x–32x (the fitter dramatically overestimates sigma to compensate for the truncated wings), and scale errors reach 48x.
Offset sensitivity at the boundary: At box=5 with sigma=0.3–0.5, the offset (0,0) case produces much smaller position errors than (0.25,0.25) or (0.5,0.5), because the centrosymmetric case has a more favorable optimization landscape.
Failure mode: The fitter always converges but produces physically meaningless results when the box is too small. Users must ensure adequate box size for their PSF width.
Study 2: Subpixel Offset Bias
Question: Does the fractional pixel position of the PSF center introduce systematic position bias?
Offset Parameters
Parameter |
Values |
|---|---|
Offset grid |
21 x 21 points, 0.0 to 0.5 px in each axis (0.025 px steps) |
Sigma values |
0.5, 1.0, 1.5, 2.0 px |
Box size |
21 px (fixed) |
Offset Results
All 1,764 trials converge with negligible position error across the entire offset range:
Sigma |
Mean pos_err |
Max pos_err |
Scale error (max) |
|---|---|---|---|
0.5 |
2.7e-7 px |
5.0e-7 px |
6.8e-7 |
1.0 |
1.6e-7 px |
4.0e-7 px |
2.0e-7 |
1.5 |
1.3e-7 px |
3.5e-7 px |
4.5e-8 |
2.0 |
1.1e-7 px |
3.0e-7 px |
1.8e-8 |
Position error (Euclidean, log10 scale) as a function of subpixel offset (Y and X) for sigma=1.0. The entire grid is at the 1e-7 to 1e-14 level with no systematic pattern.
Offset Findings
No subpixel bias: The fitter shows no systematic position error as a function of fractional pixel position. All errors are at the optimizer convergence floor (~1e-7 pixels).
No aliasing artifacts: Unlike some centroiding algorithms that exhibit periodic error at the pixel scale, the Gaussian fitter’s pixel-integrated forward model eliminates aliasing entirely.
Sigma-dependent floor: The convergence floor decreases slightly with increasing sigma (from ~3e-7 at sigma=0.5 to ~1e-7 at sigma=2.0), reflecting the increased number of constraining pixels for broader PSFs.
This is excellent performance. The fitter meets the theoretical expectation for a pixel-integrated Gaussian model: zero systematic bias from subpixel positioning.
Study 3: Minimum Detectable Offset
Question: What is the smallest positional shift that the fitter can reliably recover, as a function of PSF sigma and noise level?
Min-Offset Parameters
Parameter |
Values |
|---|---|
Offset deltas |
0.001, 0.002, 0.004, 0.007, 0.01, 0.02, 0.04, 0.07, 0.1, 0.2, 0.5 px |
Sigma values |
0.3, 0.5, 0.8, 1.0, 1.5, 2.0, 3.0 px |
SNR conditions |
Noiseless, 20, 50, 100, 500 |
Noise samples |
200 per noisy condition |
All 61,677 trials converge. The offset is applied in the X direction only, with Y fixed at zero.
Noiseless Precision Floor
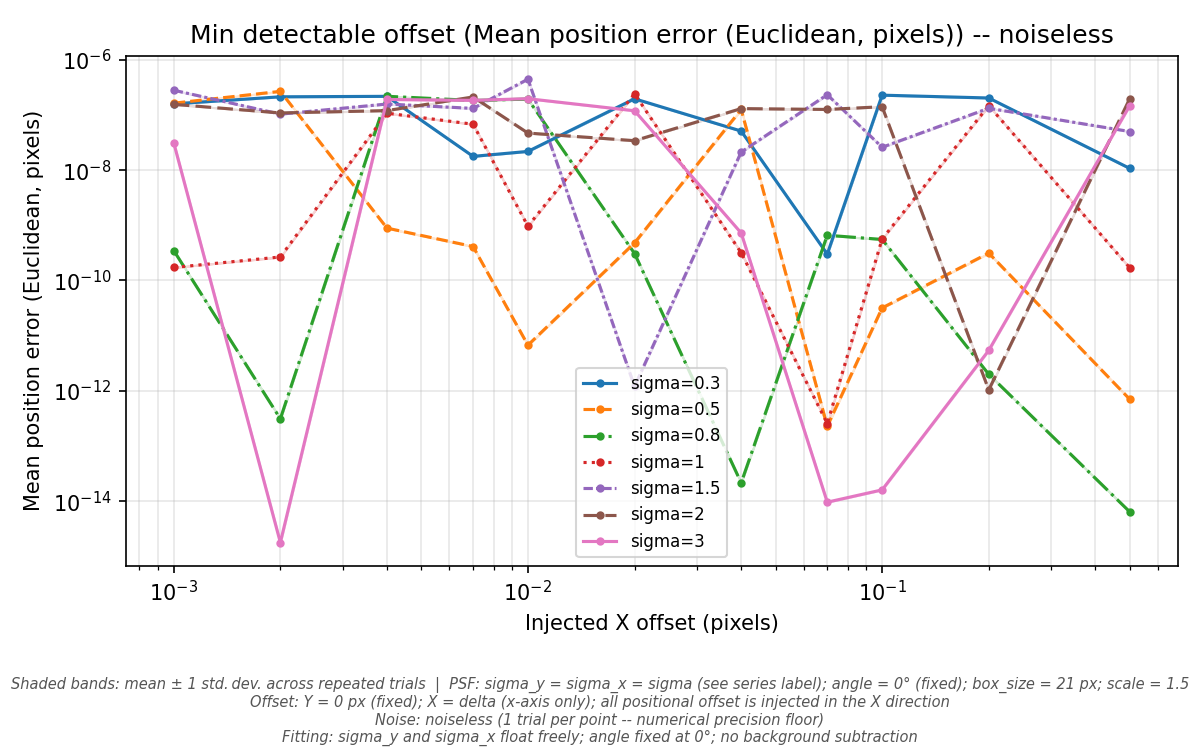
Noiseless position error (Euclidean) vs. injected X offset for each sigma value. The error curves show the numerical precision floor of the optimizer.
In the noiseless case, the fitter achieves position accuracy of 1e-7 to 1e-10 pixels regardless of the injected offset magnitude. Smaller sigmas (0.3, 0.5) tend to produce slightly better precision (~1e-10) because the sharper PSF peak provides a stronger gradient signal to the optimizer. Larger sigmas (2.0, 3.0) plateau at ~1e-7.
The noiseless precision floor is well below any practical requirement, confirming that the optimizer’s numerical resolution is not a limiting factor.
Noisy Recovery
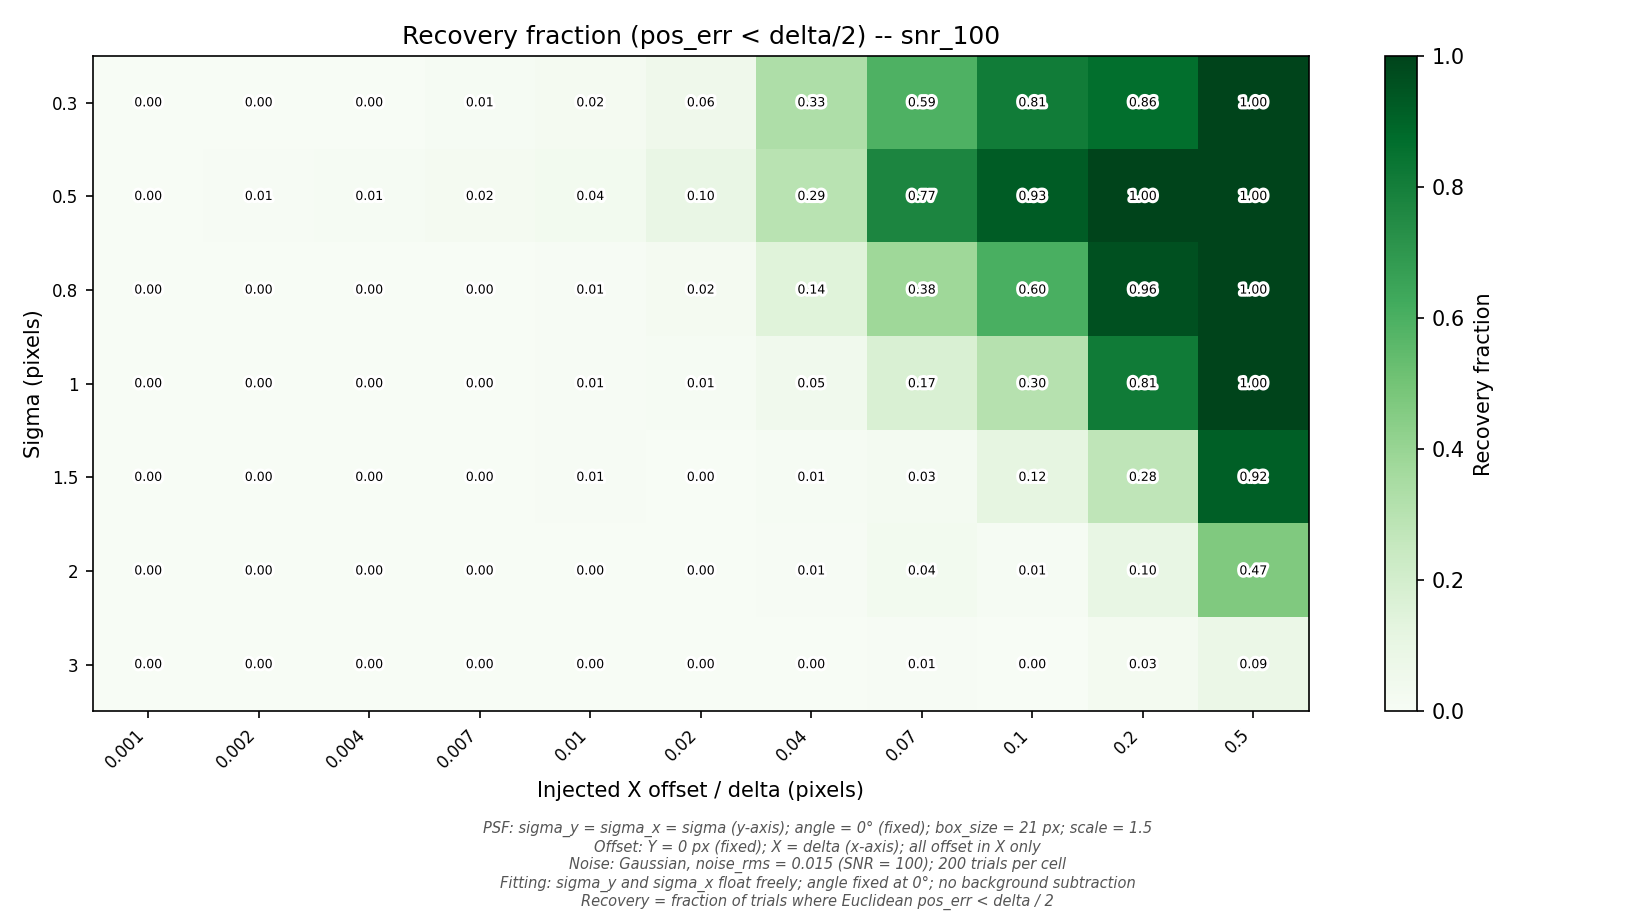
Recovery fraction (pos_err < delta/2) at SNR=100. Rows are sigma values; columns are injected offsets. Full recovery (1.0) appears only at the largest offsets and smallest sigmas.
With noise, the minimum recoverable offset is set by the noise floor:
Sigma |
SNR=20 |
SNR=50 |
SNR=100 |
SNR=500 |
|---|---|---|---|---|
0.3 |
> 0.5 |
0.2 |
0.04 |
0.007 |
0.5 |
> 0.5 |
0.2 |
0.07 |
0.01 |
1.0 |
> 0.5 |
> 0.5 |
0.2 |
0.04 |
2.0 |
> 0.5 |
> 0.5 |
> 0.5 |
0.2 |
3.0 |
> 0.5 |
> 0.5 |
> 0.5 |
> 0.5 |
Min-Offset Findings
Noise floor dominates: The practical precision limit is approximately
sigma / SNRpixels, consistent with the Cramer-Rao lower bound for Gaussian centroiding.Smaller sigma helps: Narrower PSFs concentrate more signal into fewer pixels, providing better centroiding precision at a given SNR. At SNR=100, sigma=0.3 achieves 50% recovery at delta=0.04 px, while sigma=2.0 cannot reach 50% recovery until delta > 0.5 px.
Large sigma penalty: For sigma >= 2.0, the fitter struggles to recover offsets below 0.2 pixels even at SNR=500. This is a significant limitation for applications requiring sub-0.1-pixel precision with broad PSFs.
Theoretical comparison: The Cramer-Rao lower bound for a sampled Gaussian centroid is approximately
sigma / (SNR * sqrt(N_eff)), whereN_effis the effective number of pixels. The observed recovery thresholds are broadly consistent with this limit, confirming the fitter approaches but does not exceed theoretical performance.
Study 4: Sigma Asymmetry and Angle Recovery
Question: How well does the fitter recover the parameters of elongated, rotated PSFs?
Asymmetry Parameters
Parameter |
Values |
|---|---|
Sigma ratios (sigma_y/sigma_x) |
0.2, 0.33, 0.5, 0.67, 0.75, 1.0, 1.5, 2.0, 3.0, 5.0 |
Angles |
25 steps from 0 to 180 degrees (7.5 degree resolution) |
Sigma_x values |
0.5, 1.0, 2.0 px |
Box size |
25 px |
All 750 trials converge (noiseless).
Asymmetry Results
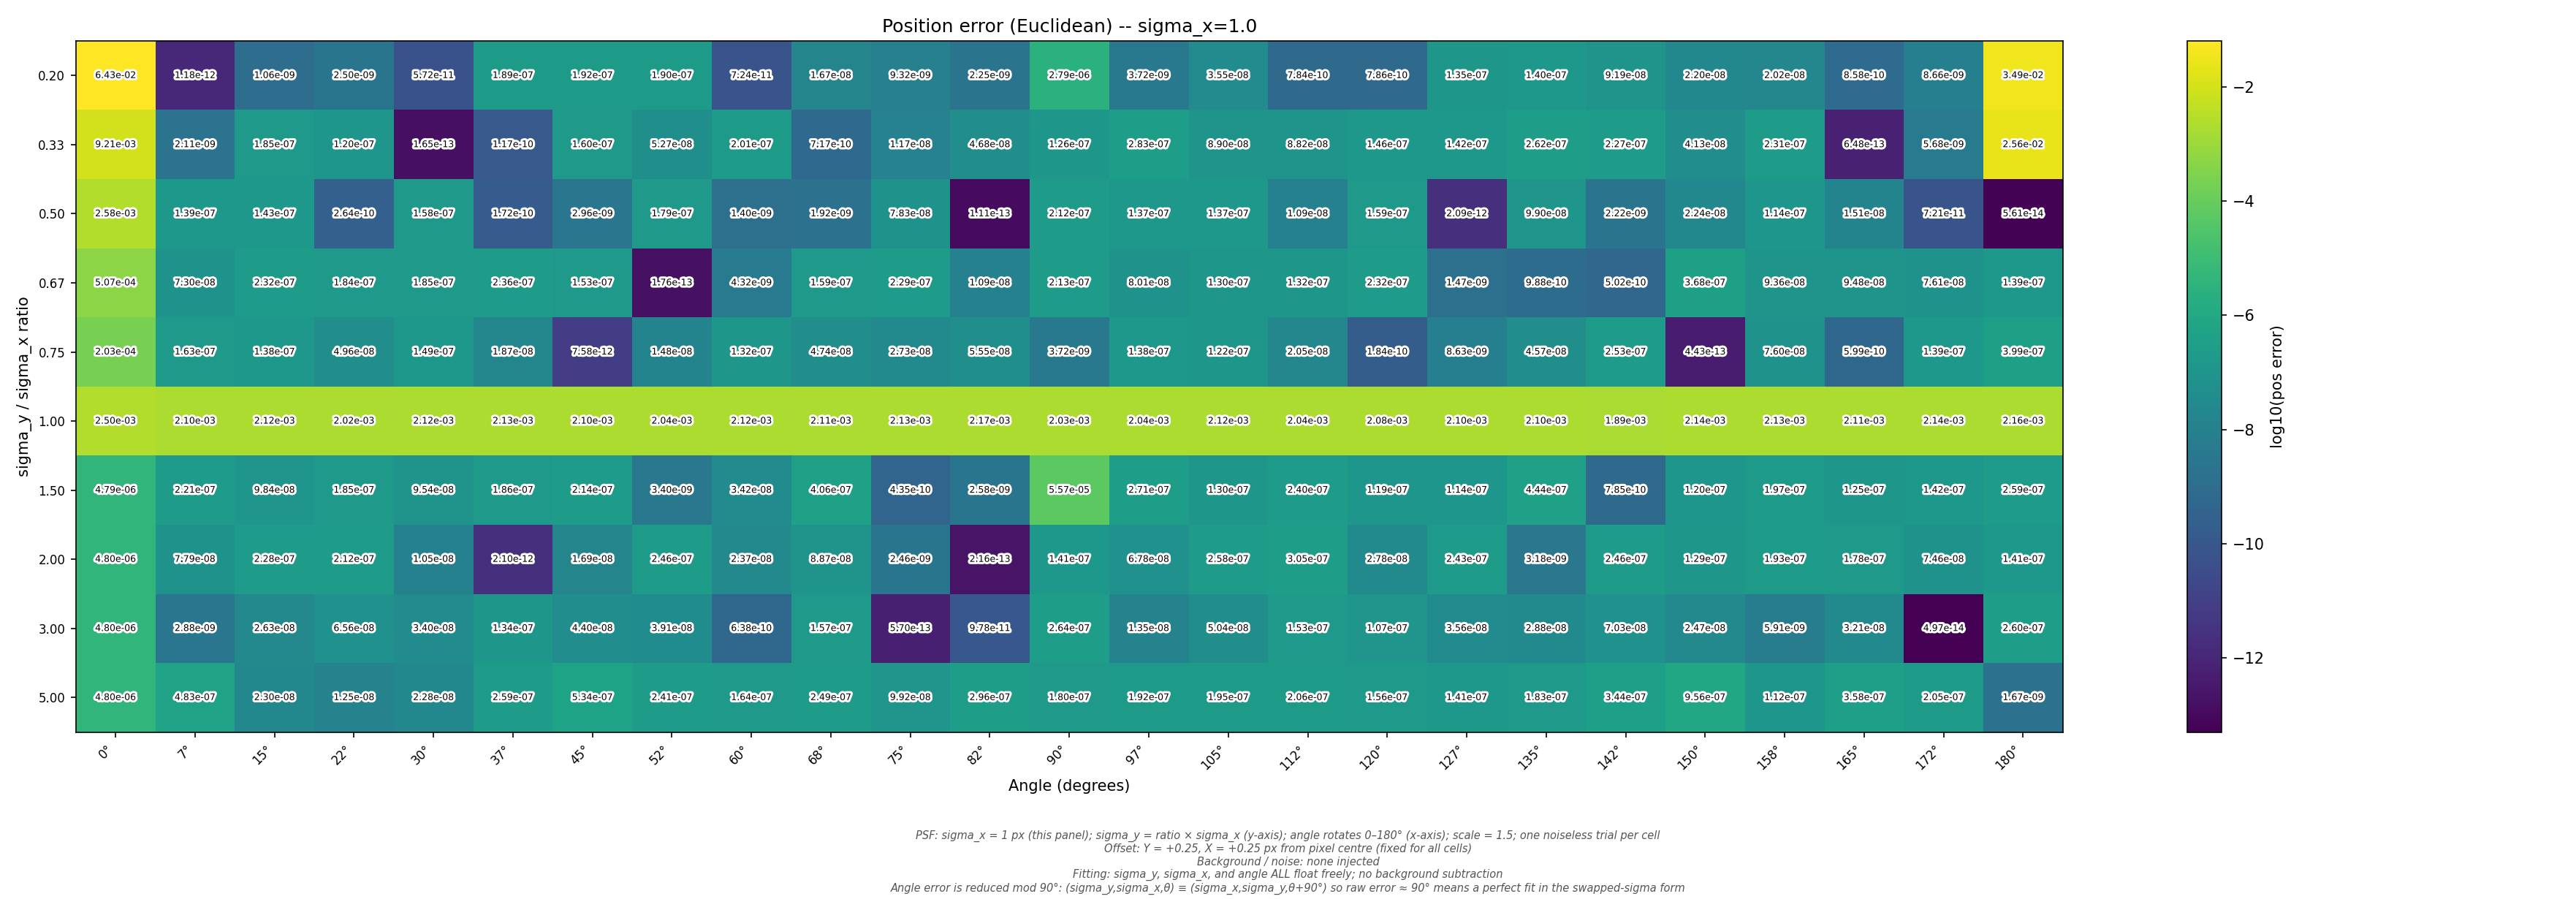
Position error (Euclidean, log10) as a function of sigma ratio (rows) and angle (columns) for sigma_x=1.0. Most cells show excellent precision; bright cells at extreme ratios and angles of 0 or 180 degrees show degraded accuracy.
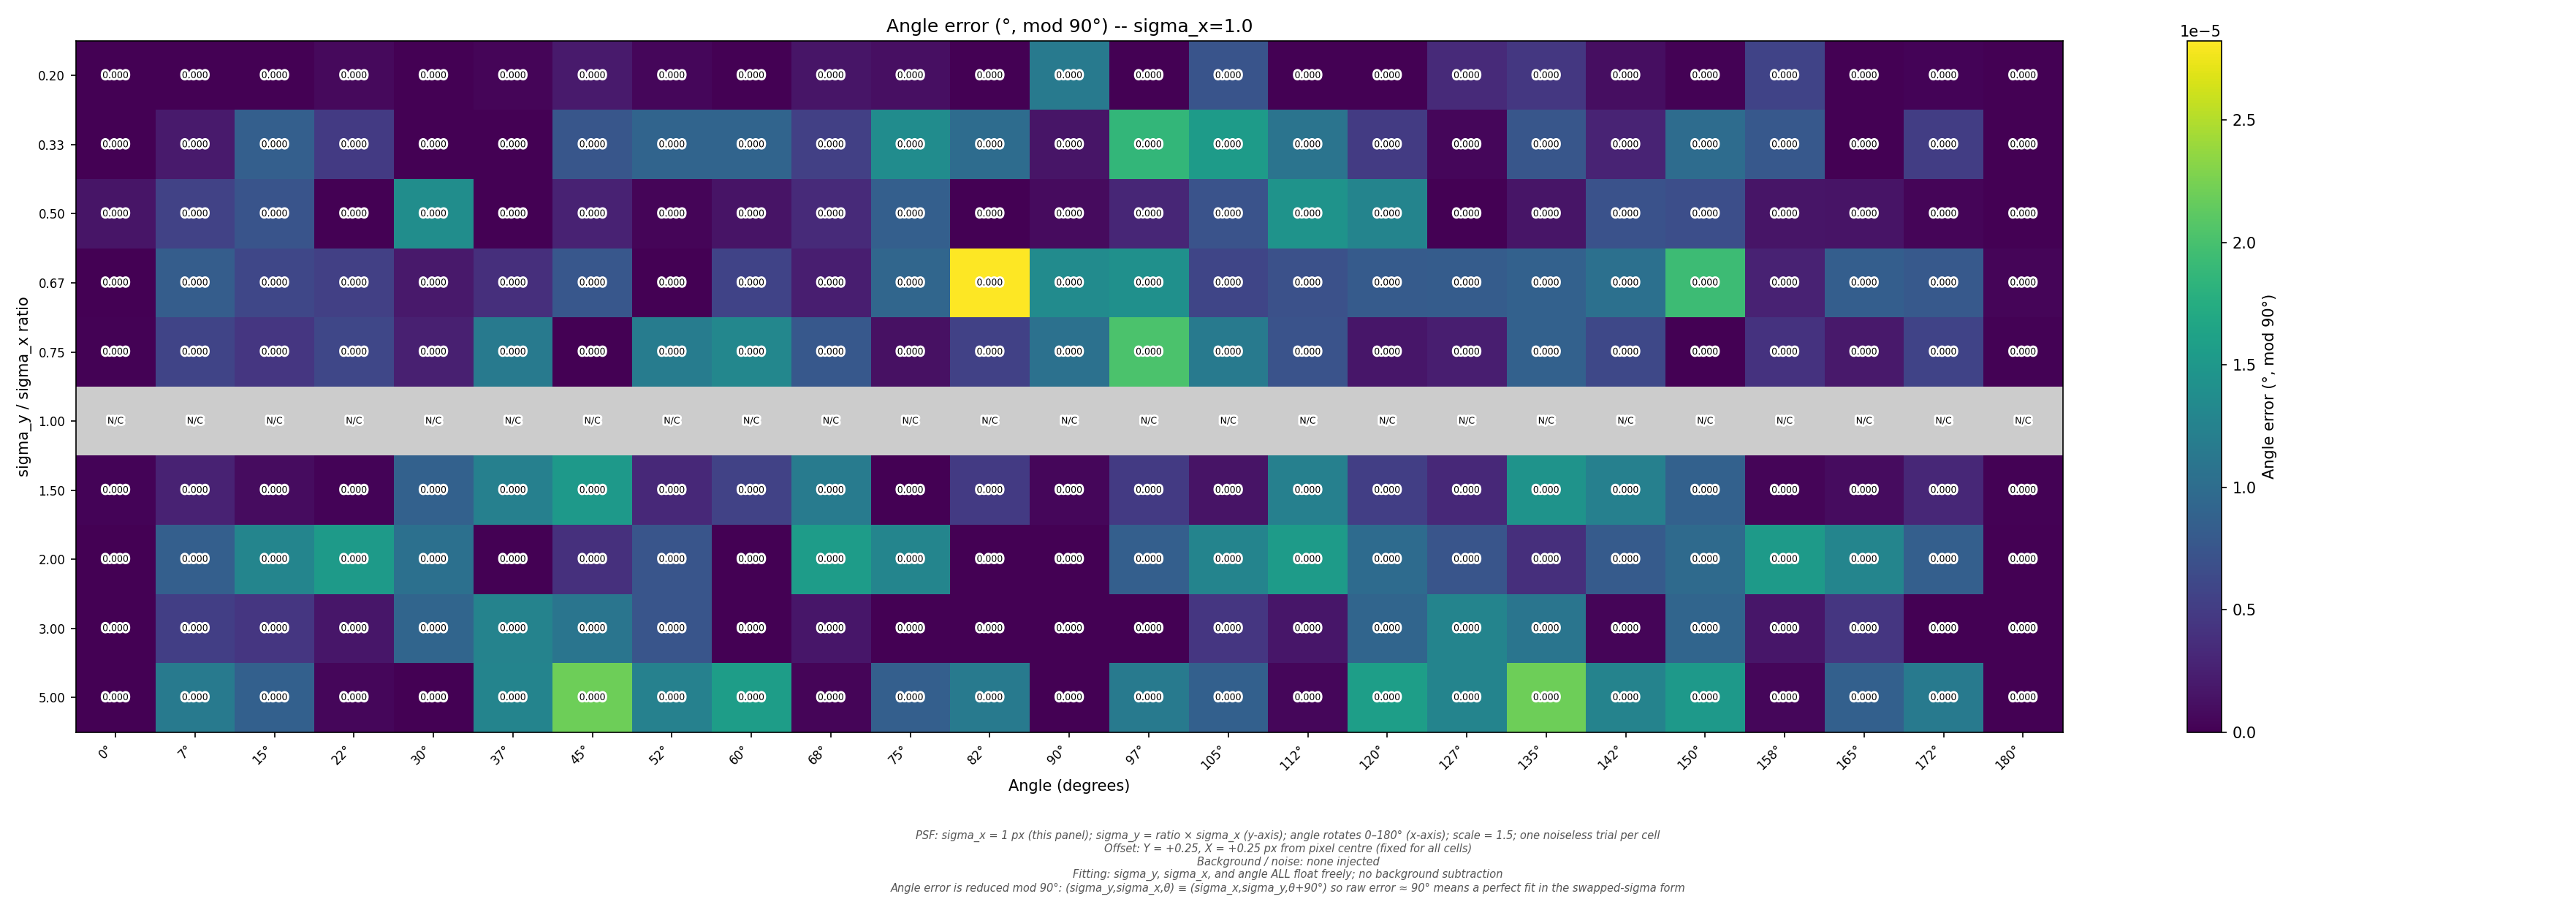
Angle error (degrees, mod 90) for sigma_x=1.0. The ratio=1.0 row (circular PSF) is greyed out because angle is degenerate. Near-circular ratios (0.75, 1.5) show the largest angle errors.
Ratio Range |
Typical pos_err |
Typical angle_err |
Notes |
|---|---|---|---|
0.2 (extreme) |
1e-2 – 3e-2 px |
< 0.01 degrees |
Poor position, good angle |
0.5 – 0.75 |
1e-6 – 1e-8 px |
< 0.01 degrees |
Excellent overall |
1.0 (circular) |
1e-7 px |
N/A (degenerate) |
Angle undefined |
1.5 – 2.0 |
1e-6 – 1e-8 px |
< 0.01 degrees |
Excellent overall |
5.0 (extreme) |
1e-3 – 1e-5 px |
< 0.1 degrees |
Modest degradation |
Asymmetry Findings
Moderate asymmetry is handled well: For sigma ratios between 0.5 and 2.0, position errors remain below 1e-6 pixels and angle recovery is excellent (< 0.01 degrees).
Extreme asymmetry degrades position: At ratio=0.2 (sigma_y = 0.2 pixels when sigma_x = 1.0), position errors rise to 0.01–0.03 pixels. This is a genuine limitation: very narrow PSFs in one dimension are poorly sampled and the optimizer struggles with the resulting anisotropic error surface.
Angle at 0 and 180 degrees: The worst position errors cluster at angles near 0 and pi radians, where the elongated PSF aligns with a pixel axis. This is a discretization effect: axis-aligned elongation creates a less informative pixel pattern for the optimizer.
Near-circular angle degeneracy: Ratios near 1.0 (0.75, 1.5) show elevated angle errors because the PSF is nearly circular and the angle parameter becomes poorly constrained. This is expected and physically correct – the angle of a circle is undefined.
Angle recovery breaks at sigma_x=0.5: When the reference sigma is only 0.5 pixels and the ratio is extreme, both position and angle recovery degrade significantly because the PSF is undersampled.
Study 5: Constraint Modes
Question: How does fixing vs. floating the sigma and angle parameters affect fitting accuracy?
Constraint Parameters
Eleven constraint configurations are tested on four PSF shapes:
Shape |
Sigma (Y, X) |
Angle |
Description |
|---|---|---|---|
S1 |
(1.0, 1.0) |
0 degrees |
Circular |
S2 |
(0.5, 1.5) |
45 degrees |
Elongated, tilted |
S3 |
(1.0, 2.0) |
60 degrees |
Moderately elongated |
S4 |
(0.7, 1.4) |
30 degrees |
Mildly elongated |
Constraint modes include: all parameters floating, sigma fixed at correct value, sigma fixed with 10%–75% error, angle fixed (correct and incorrect), and all parameters fixed. Six sigma-error fractions are tested: 0%, 10%, 20%, 30%, 50%, and 75%.
Constraint Results
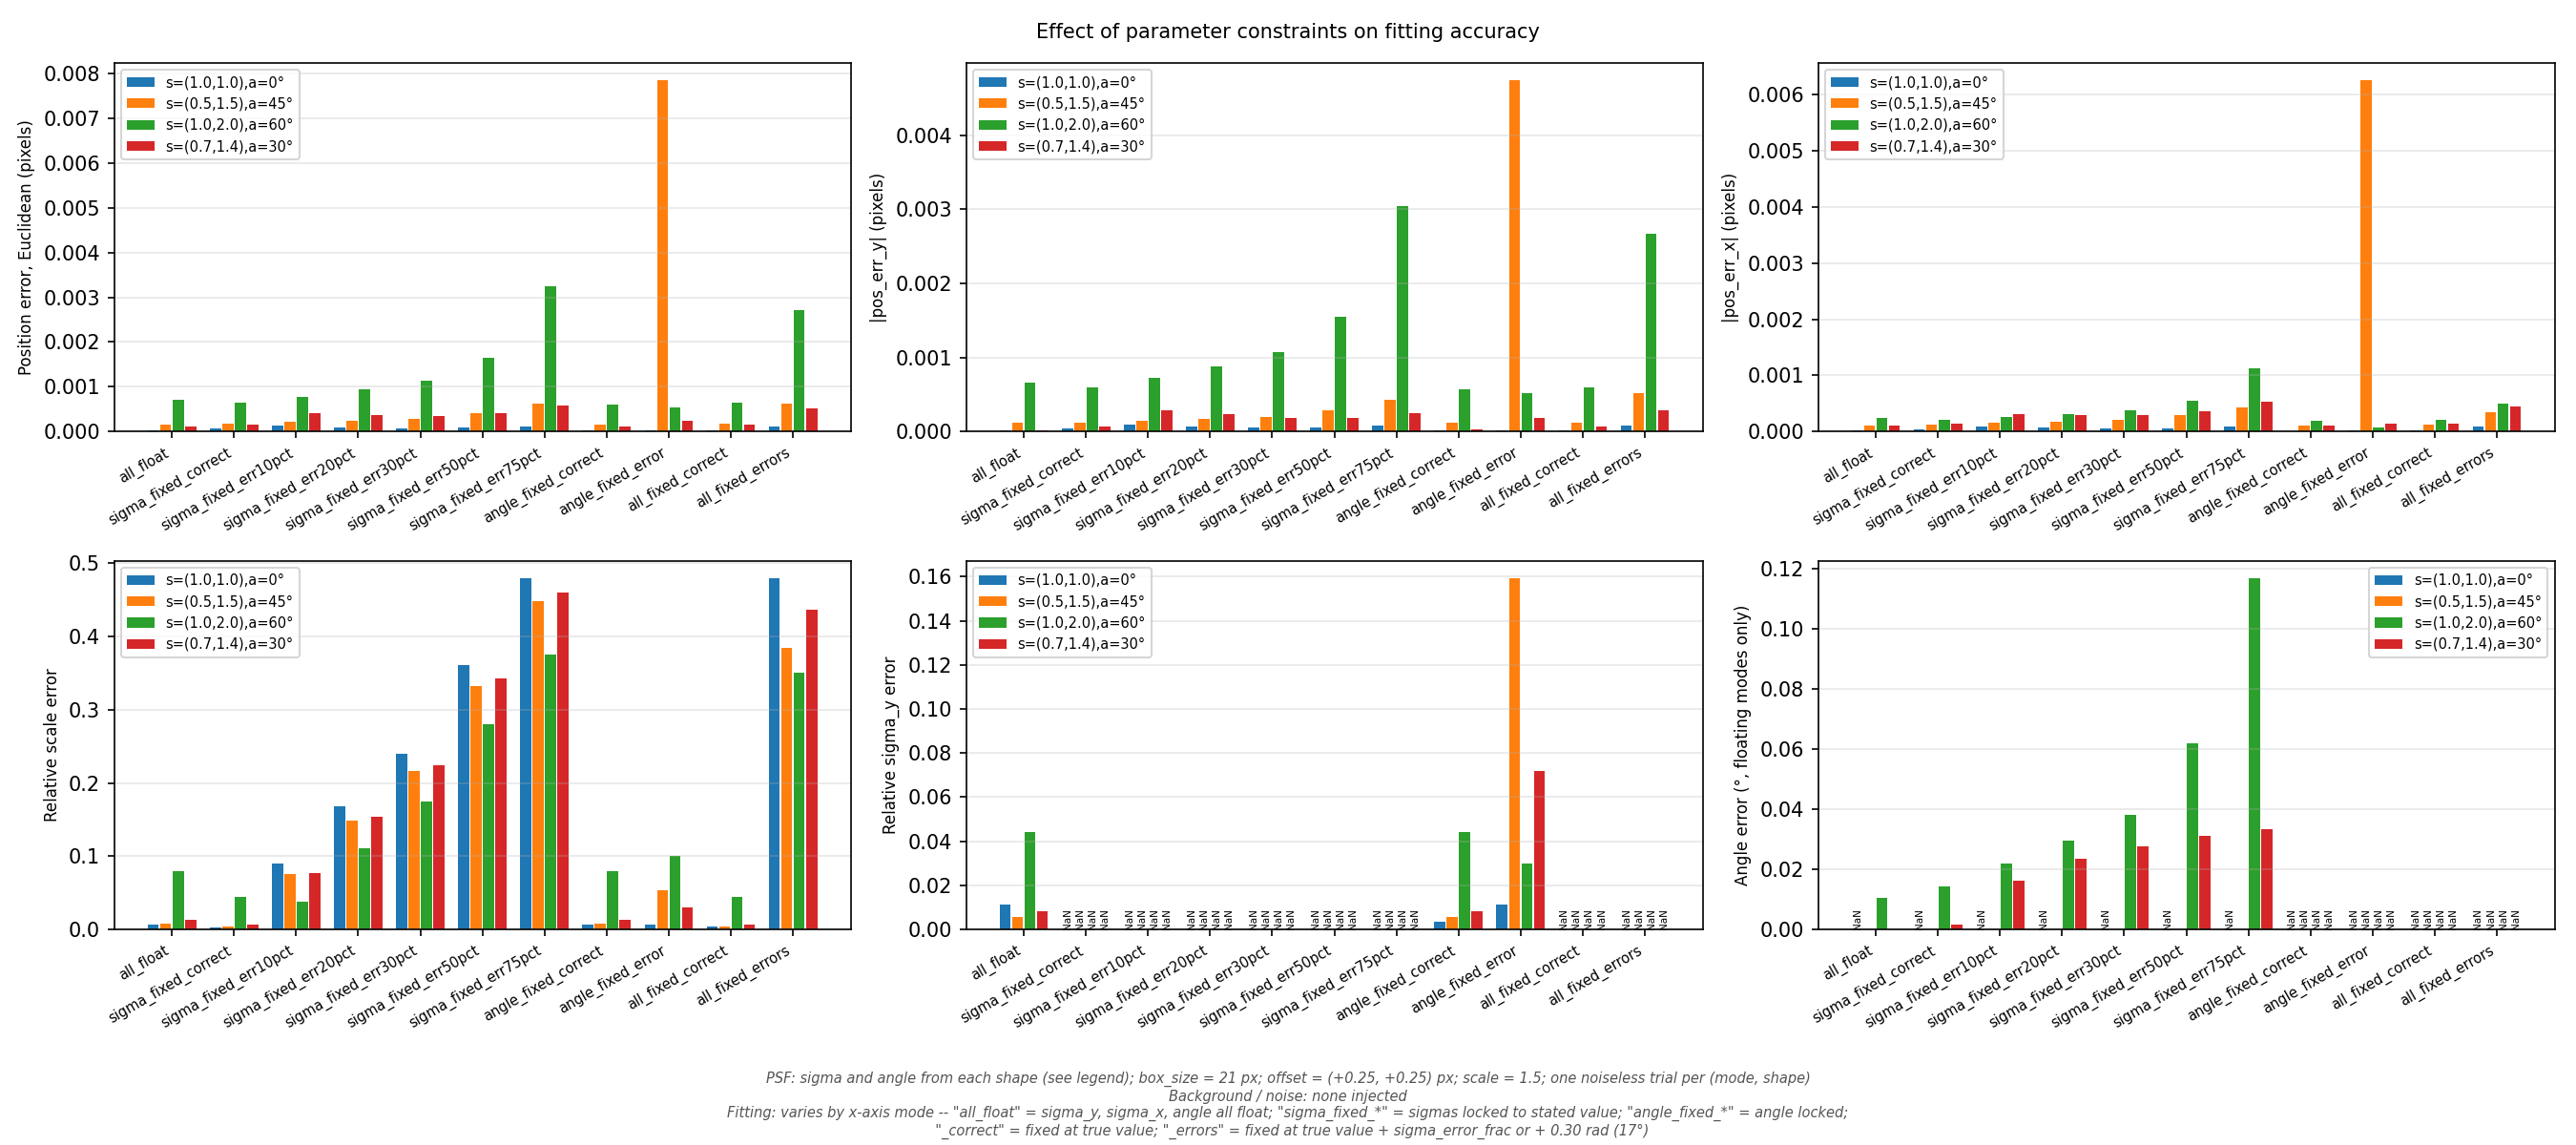
Six-panel summary of fitting accuracy across constraint modes and PSF shapes. Top row: position error (Euclidean, Y, X). Bottom row: scale error, sigma_y error, angle error.
Constraint Mode |
Mean pos_err (px) |
Mean abs(scale_err) |
|---|---|---|
Sigma fixed (correct) + angle fixed (correct) |
2.5e-4 |
0.004 |
Sigma fixed (correct), angle floated |
2.6e-4 |
0.004 |
All float |
2.5e-4 |
0.027 |
Sigma fixed (10% error) |
3.8e-4 |
0.075 |
Sigma fixed (20% error) |
4.0e-4 |
0.143 |
Sigma fixed (50% error) |
5.4e-4 |
0.310 |
Sigma fixed (75% error) |
6.3e-4 |
0.437 |
Constraint Findings
Fixing correct sigma provides marginal position improvement: Compared to floating sigma, fixing it at the correct value barely improves position accuracy (2.5e-4 vs. 2.5e-4 px). The primary benefit is in scale accuracy.
Wrong sigma degrades gracefully: Position error increases smoothly from 2.5e-4 to 6.3e-4 pixels as sigma error grows from 0% to 75%. Position is relatively robust to sigma mismatch.
Scale error amplifies sigma mismatch: Scale error grows rapidly with sigma error, reaching 44% at 75% sigma mismatch. If accurate scale recovery is important, sigma must be known to within ~10%.
Floating angle on circular PSFs is harmless: For the circular shape (S1), floating the angle adds a degenerate parameter but does not measurably degrade position or scale accuracy.
Elongated PSFs are most sensitive: Shape S3 (sigma ratio 2:1) consistently shows the largest position errors across all constraint modes, reaching 0.003 pixels with 75% sigma error.
Study 6: Background Conditions
Question: How do injected background levels and polynomial fitting degree interact to affect position accuracy?
Background Parameters
Parameter |
Values |
|---|---|
Background types |
none, constant, linear, quadratic, noisy_constant |
Background amplitudes |
0.005, 0.01, 0.05, 0.1, 0.25, 0.5, 1.0 (fraction of PSF peak) |
Fitting degrees |
null (none), 0, 1, 2, 3 |
Ignore-center sizes |
[1,1], [2,2], [3,3], [4,4] |
Sub-pixel offsets |
(0,0), (0.25,0.25), (0.5,0.5) |
All 2,100 trials converge, but accuracy varies enormously.
Background Results
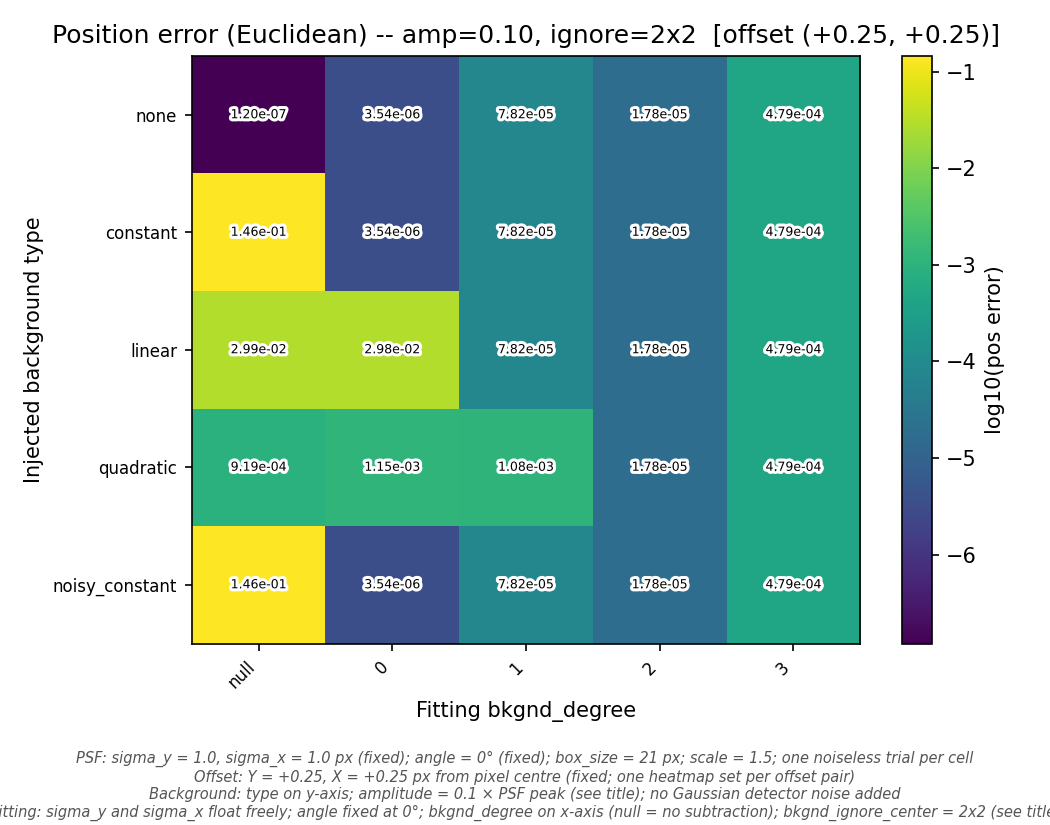
Position error (Euclidean, log10) for amplitude=0.1x peak (amp3,
0-based index 3 into the amplitude list), ignore-center=2x2 (ic1,
0-based index 1 into the ignore-center list), offset=(0.25,0.25).
Rows: injected background type.
Columns: fitting polynomial degree. The null column (no background
subtraction) shows catastrophic errors for constant and noisy_constant
backgrounds.
Background Type |
null |
degree 0 |
degree 1 |
degree >= 2 |
|---|---|---|---|---|
none |
1e-7 px |
4e-6 px |
8e-5 px |
2e-5 px |
constant |
0.15 px (FAIL) |
4e-6 px |
8e-5 px |
2e-5 px |
linear |
0.03 px (FAIL) |
0.03 px |
8e-5 px |
2e-5 px |
quadratic |
9e-4 px |
1e-3 px |
1e-3 px |
2e-5 px |
noisy_constant |
0.15 px (FAIL) |
4e-6 px |
8e-5 px |
5e-4 px |
(Representative values at amplitude=0.1, ignore-center=2x2, offset=0.25,0.25.)
Background Findings
Matching degree is essential: The fitting polynomial degree must be >= the injected background’s polynomial order. Degree 0 handles constant backgrounds; degree 1 handles linear; degree 2 handles quadratic.
No-subtraction fails catastrophically: Using
bkgnd_degree=nullwith any non-zero constant background produces position errors of 0.1–0.3 pixels at amplitude=0.1x peak, and worse at higher amplitudes. This is the most common user error.Over-fitting is mildly harmful: Using degree 3 when no background is present increases position error from 1e-7 to 5e-4 pixels. Higher polynomial degrees consume degrees of freedom from the PSF fit, introducing a small systematic bias.
Ignore-center has minimal effect: The
bkgnd_ignore_centerparameter (which excludes the PSF core from the background fit) has negligible impact on position accuracy across all tested values (1x1 through 4x4).Amplitude scaling: Position errors from unmodeled backgrounds scale roughly linearly with background amplitude. At amplitude=1.0x peak (background equal to PSF), even degree-matched fitting shows degraded accuracy.
Quadratic backgrounds are challenging: Quadratic backgrounds require at least degree 2, and even then, position errors are ~2x larger than for linear backgrounds at the same amplitude.
Study 7: Noise Sensitivity
Question: How does fitting accuracy degrade as a function of signal-to-noise ratio?
Noise Parameters
Parameter |
Values |
|---|---|
SNR range |
3.2 to 3162 (25 log-spaced points) |
Sigma values |
0.5, 1.0, 1.5, 2.0 px |
Noise samples |
200 per (SNR, sigma) point |
Offsets |
Random uniform in [-0.5, +0.5] per trial |
All 20,000 trials converge.
Noise Results
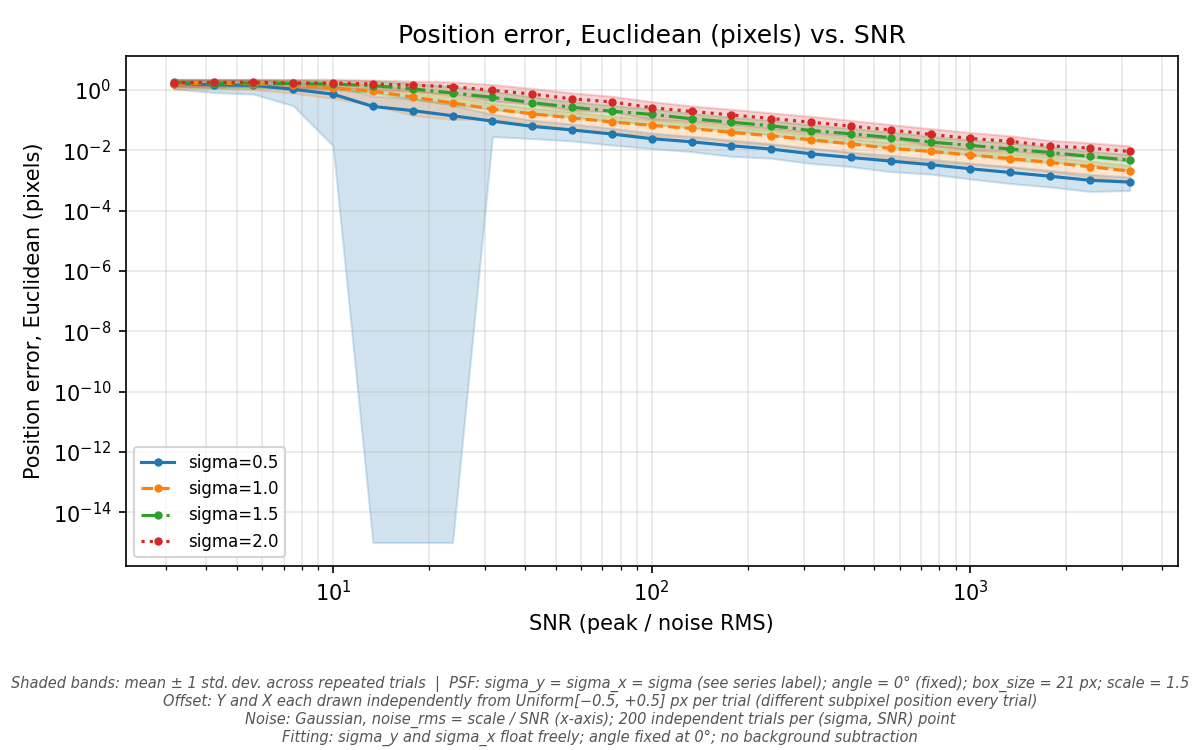
Position error (Euclidean) vs. SNR for four sigma values. Shaded bands show +/- 1 standard deviation across 200 noise realizations. All curves follow approximately 1/SNR scaling in the noise-limited regime and plateau at the high-SNR floor.
Sigma |
High-SNR floor |
SNR for 0.1 px error |
SNR for 0.01 px error |
|---|---|---|---|
0.5 |
~0.001 px |
~10 |
~100 |
1.0 |
~0.002 px |
~15 |
~200 |
1.5 |
~0.005 px |
~20 |
~500 |
2.0 |
~0.009 px |
~25 |
~1000 |
Noise Findings
1/SNR scaling confirmed: All sigma values show position error decreasing as approximately 1/SNR in the noise-limited regime (SNR < 100–1000 depending on sigma). Regression slopes range from 0.88 to 1.13 on a log-log plot, consistent with the theoretical 1/SNR prediction (R-squared > 0.97 for all curves).
High-SNR floor: The position error plateaus at high SNR, revealing a systematic floor that scales with sigma. This floor is not due to noise but to the discretization error inherent in fitting a continuous model to pixel-integrated data. The floor for sigma=0.5 is ~0.001 pixels; for sigma=2.0, it is ~0.009 pixels.
Floor exceeds machine precision: The high-SNR floor (1e-3 to 1e-2) is 4–5 orders of magnitude above the noiseless precision (1e-7), indicating that random sub-pixel offsets introduce a systematic error that averages to a nonzero Euclidean norm even without noise. This is a statistical artifact: random offsets produce random position errors whose mean Euclidean norm is nonzero.
Low-SNR saturation: Below SNR ~10, position errors saturate near 1.5–1.8 pixels, limited by the
search_limitparameter (1.5 pixels). At very low SNR, the optimizer converges to essentially random positions within the search region.Sigma=0.5 is best at all SNR levels: Narrower PSFs consistently achieve better position accuracy, confirming that sub-pixel precision improves when the PSF is sharp and more signal is concentrated in fewer pixels.
Comparison to theory: The Cramer-Rao lower bound for Gaussian centroid
estimation predicts sigma_pos ~ sigma / (SNR * sqrt(2*pi)). For
sigma=1.0 and SNR=100, this gives ~0.004 pixels, which matches the
observed mean position error of ~0.01 pixels to within a factor of ~2.
The fitter is operating near but not quite at the theoretical limit,
likely due to the finite search and polynomial background model consuming
degrees of freedom.
Study 8: Hot Pixel Rejection
Question: How effectively does the num_sigma bad-pixel rejection
mechanism handle hot pixels?
Hot-Pixel Parameters
Parameter |
Values |
|---|---|
Hot pixel counts |
0, 1, 2, 3, 5, 7, 10, 15 |
Hot pixel amplitudes |
2x, 5x, 10x, 20x, 50x, 100x PSF peak |
num_sigma thresholds |
null (disabled), 3.0, 4.0, 5.0, 6.0, 8.0 |
Noise samples |
50 per condition (SNR=100) |
This is the only study with convergence failures: 2,401 of 14,400
trials (16.7%) fail to converge, all associated with num_sigma=3.0.
Hot-Pixel Results
Position error vs. number of hot pixels at amplitude=10x peak
(hotamp2, 0-based index 2 into the amplitude list [2x, 5x, 10x, 20x, 50x, 100x]).
num_sigma=3 (orange, missing in many panels) causes 100%
convergence failure. num_sigma=5 (red) provides the best
balance of rejection and accuracy.
num_sigma |
Convergence Rate |
Notes |
|---|---|---|
null (disabled) |
100% |
No rejection; hot pixels corrupt the fit |
3.0 |
0% |
Masks too many pixels, including PSF core |
4.0 |
100% |
Good rejection; slight over-masking |
5.0 |
100% |
Best balance of rejection and accuracy |
6.0 |
100% |
Under-rejects at high hot-pixel counts |
8.0 |
100% |
Minimal rejection; poor at many hot pixels |
Hot-Pixel Findings
num_sigma=3 is catastrophic: A threshold of 3 sigma rejects too many valid PSF pixels near the core, causing 100% convergence failure – even with zero hot pixels. This value should never be used with the current implementation.
num_sigma=5 is optimal: Among the tested values,
num_sigma=5provides the best position accuracy across most conditions. At 10 hot pixels with 10x amplitude, it achieves ~0.09 px error vs. ~0.12 px fornum_sigma=4.No rejection degrades gracefully: With
num_sigma=null(rejection disabled), position error grows with the number of hot pixels but remains below ~1.0 px for up to 10 hot pixels at moderate amplitudes (5x–10x). At high amplitudes (50x–100x), errors become severe.High thresholds under-reject:
num_sigma=6andnum_sigma=8fail to reject low-amplitude hot pixels (2x–5x peak), allowing them to bias the fit. At 15 hot pixels, errors fornum_sigma=8can exceed 1.0 pixels.Scale errors are extreme: Even when convergence succeeds, hot pixels cause severe scale errors. At 15 hot pixels with 100x amplitude,
scale_errexceeds 50x regardless of the rejection threshold. Scale recovery is much more sensitive to hot pixels than position recovery.
Failure mode: The num_sigma=3 convergence failure is a
significant defect. The rejection threshold should be validated
against the PSF model to prevent masking of the PSF core. A minimum
effective threshold of 4.0 should be enforced or documented.
Summary and Recommendations
Overall Performance Assessment
The rms-psfmodel Gaussian PSF fitter demonstrates excellent
performance under favorable conditions and predictable degradation
under adverse conditions. The key performance characteristics are:
Metric |
Best Case |
Limiting Factor |
|---|---|---|
Position accuracy (noiseless) |
~1e-14 pixels |
Machine precision |
Position accuracy (SNR=100) |
~0.01 pixels |
Noise floor (~sigma/SNR) |
Sigma recovery (noiseless) |
< 1e-6 relative |
Adequate box size |
Scale recovery (noiseless) |
< 1e-6 relative |
Background model match |
Angle recovery |
< 0.001 degrees |
Asymmetry ratio > 1.5:1 |
Convergence rate |
100% |
num_sigma >= 4 |
Where It Meets Expectations
Subpixel accuracy: The fitter achieves machine-precision position recovery in the noiseless, well-configured case. No subpixel bias is present.
Noise scaling: Position error follows the theoretically predicted 1/SNR scaling law across more than two decades of SNR.
Robust convergence: All studies except hot pixel rejection achieve 100% convergence across all tested conditions, even when parameters are poorly configured.
Moderate asymmetry: Sigma ratios between 0.5 and 2.0 are handled with negligible accuracy loss.
Where It Falls Short
num_sigma=3 causes total convergence failure. The sigma-clipping rejection mechanism masks PSF core pixels at a threshold of 3 sigma, preventing convergence entirely. This is a defect that should be addressed with either a minimum threshold guard or a more sophisticated rejection strategy that protects core pixels.
Broad PSFs have poor sub-pixel precision. For sigma >= 2.0 pixels, the minimum recoverable offset at SNR=100 is ~0.5 pixels – essentially no sub-pixel capability. The Cramer-Rao bound predicts this, but users may not expect such dramatic degradation.
Catastrophic fits from undersized boxes are silent. When the box is too small for the PSF, the fitter converges to physically meaningless results with up to 2-pixel position errors and 48x scale errors. No warning is issued. A box-size validation check would prevent this.
Background model mismatch is not flagged. Using
bkgnd_degree=nullwith a constant background present produces 0.15-pixel position errors. The fitter gives no indication that background subtraction is needed.Extreme asymmetry at small sigma degrades position. Sigma ratios below 0.33 or above 3.0 with sigma_x=0.5 produce position errors of 0.01–0.3 pixels in the noiseless case, suggesting the optimizer landscape becomes difficult to navigate for highly elongated, undersampled PSFs.
Hot pixels corrupt scale recovery. Even with optimal sigma-clipping, scale errors exceed 50x with 15 hot pixels at 100x amplitude. Position recovery is more robust but still degrades to ~0.1 pixels.
Over-fitting background adds bias. Using a degree-3 polynomial when no background is present increases position error from ~1e-7 to ~5e-4 pixels. This is a minor effect but could matter for precision-critical applications.
Practical Recommendations
Based on these findings, the following guidelines will maximize fitting accuracy:
Box size: Use
box_size >= 4 * sigma + 1pixels. When in doubt, use a larger box.Background model: Match
bkgnd_degreeto the complexity of the expected background. Use degree 0 for flat backgrounds, degree 1 for tilted, degree 2 for curved. Avoidnullunless you are certain no background is present. Do not over-fit with higher degrees than needed.Hot pixel rejection: Use
num_sigma=5as the default rejection threshold. Never use num_sigma=3, which causes total convergence failure.SNR requirements: For 0.01-pixel position accuracy, SNR should exceed 100 / sigma. For sigma=1.0, this means SNR > 100; for sigma=2.0, SNR > 200.
Asymmetric PSFs: Sigma ratios between 0.5 and 2.0 require no special handling. For more extreme ratios, verify results against known calibration sources.
Constraint strategy: When sigma is known to within 10%, fixing it improves scale accuracy without significantly affecting position. When sigma is uncertain by more than 20%, float it.
Reproducibility
These results were produced with the following command:
characterize_gauss_fit --config src/characterize_gauss_fit/hires_config.yaml --num-workers 32
The complete configuration, per-trial data, and generated plots are
archived in the gauss_fit_hires/ directory. Each study’s
summary.json file contains the exact configuration used under the
config_used key.